Functional programming techniques makes it possible to reduce the amount of boiler plate code required when working with JavaScript libraries that require traditional callback functions. This blog will show how to drastically reduce the code and how to turn the callback handlers into observables.
I was working on hooking the AWS Cognito JS SDK into my Angular 4 project. I was using SytemJS and RollupJS and after struggling for some time to get the bundling to work properly, I gave up and decided to just use the plain JavaScript API.
This meant that not only was I missing the nice TypeScript typings for the SDK, but also faced with the clunky callback patterns used in some JavaScript API’s.
There are various common JavaScript patterns for handling async methods via callbacks. These callback mechanisms allow callers to provide a hook so that they can be called back in the future with the result or error.
One common approach is that the method requires a single callback function in addition to its normal parameters. The called function will then invoke the callback function with an error as the first parameter, or a result as the second parameter. It is up to the callback function to determine whether it received an error or not.
The following contrived example shows how the sendMsg
function will invoke the callback and pass an error message or success result.
1 2 3 4 5 6 7 8 9 10 11 12 13 14 15 16 17 |
|
As mentioned before there are other common ways to do callbacks such as requiring separate success and error handling functions, or using objects with onSuccess
and onFailure
methods. However, the solution is similar regardless of the callback pattern followed so the rest of this article will use the single callback function approach above as the example.
Calling such a JavaScript function from TypeScript looks something like this:
1 2 3 4 |
|
This is all fine and works ok but I don’t want the clients of my code to have to pass a callback handler. What I really want is to return an Observable to my clients. I can achieve this as follows:
1 2 3 4 5 6 7 8 9 10 11 12 13 14 15 16 |
|
However the bit on line 6
where we check for the error is a bit tedious. I will have to duplicate this all over the place and I don’t necessarily know what to do with the error. In most cases I will just send it along for the client to deal with.
To get rid of the error handling duplication I write a function to take the subject, success and optional error handler functions and return a callback function
1 2 3 4 5 6 7 8 9 10 11 12 13 14 15 16 17 18 19 |
|
The interface CallbackFunction
cleans the method signature up a bit and makes things a bit easier to read.
The returned callback function checks the error and, if an error handler was provided, applies it before calling error
on the subject (line 5)
. If no error is provided to the callback function then it will call next
on the subject to pass the valid result on to the observers.
This means that I can now rewrite the send message code as follows:
1 2 3 4 5 6 7 8 9 10 11 12 13 |
|
This is much better since I don’t have to call next
and error
on the subject and I don’t have to check for the error anymore. There is also much less code because I no longer have to explicitly handle the error. It can be fully delegated to the observers of the subject.
However, this still not perfect. I will be duplicating the Subject
and Observable
creation lines everywhere. It also looks a bit weird to be creating a Subject and passing it on to another function.
I can get rid of the statements on lines 3 and 12
above by writing another function which will return the Observable, relieving me from creating the subject explicitly.
Consider the following snippet:
1 2 3 4 5 6 7 8 |
|
Here I add another function exec
which will create a subject, turn the subject into a handler using subToHandler
defined earlier, apply the function provided as first parameter and then return an observable.
Note that I create the observable on line 4
before applying the function fn
. This is important since subject will only notify its subscribers of changes after the time they subscribed. Line 6
wraps the call to the function fn
in a timeout to handle the case where fn
doesn’t actually call the callback function asynchronously.
You’ll also notice that the first parameter to exec, fn
, is a function which takes a CallbackFunction
as its sole parameter. The JavaScript library functions require parameters in addition to the callback funtion, so I cannot pass the JavaScript function in to exec
.
Consider the following rewrite of the sendMessage
function:
1 2 3 4 5 6 7 8 9 10 |
|
Here I effectively partially applied the original sendJS.sendMsg
function by closing over the value of the first argument, message
, and returning a new function which takes only a callback function as parameter. This allows the exec
function to create the appropriate callback function, using subToHandler
and pass it to the partially applied sendMsg
.
By using some basic functional programming techniques I could reduce the amount of boiler plate code required when working with JavaScript libraries with traditional callback functions. I managed to reduce the code drastically and turned the callback handler into an Observable which clients of my service can subscribe to.
]]>The problem was that when I reached for letters in the middle of the keyboard such as T
or Y
the inside bit of my palm would touch the touchpad in the top corner. The touchpad percieved that as a tap and I’d continue typing wherever the mouse pointer was at the time.
I usually have a mouse plugged in and have set the touchpad to be disabled when a mouse is plugged in. I used these instructions from askubuntu to do that. It helped but I do quite a bit of work away from a desk and then I need the touchpad enabled.
After a bit of googling a found a couple of questions on answers on numerous forums and managed to piece things together from there. See the references at the bottom of the post.
To make it work you first you have work out what your touchpad is called internally. You do this by running:
1
|
|
which prints something like this:
From this output you can see there are a number of touch input devices:
Look for the one called ‘Touchpad’. You can now list all the configuration for this device by using xinput list-props
. For the XPS it is:
1
|
|
This yields a long list of properties and their values. Look for the following:
In my case these where set as follows:
Property | Value | Description |
---|---|---|
Synaptics Palm Detection | 0 | This means palm detection is off |
Synaptics Palm Dimensions | 10, 200 | The first value refer to the minimum |
Synaptics Area | 0, 0, 0, 0 | This describe the touchpad surface area where touches are detected. |
Most of the references I found was talking about changing the first two properties Synaptics Palm Detection
and Synaptics Palm Dimensions
however, changing those
didn’t make a difference for me. The cursor still jump around because my palm looks like a finger at the edge of the touchpad no matter how small I make the palm detection setting. This is understandable since only a small part of my palm actually touches the touchpad surface while typing.
The setting which made the biggest difference for me was the last one Synaptics Area
. It is used to manage the detection of touches at the edges of the touchpad.
By changing the four values associated with Synaptics Area you can change the area of the touchpad that is active to touches.
Note that the
Synaptics Area
is about inital touches. The disabled areas still work if a touch is initated in the active area
The first value defines how far from the left of the touchpad edge touches are detected. Anything to the left of this value is not considered a touch. The second value sets how far to the right the active part of the touchpad stretches. The third sets how far from the top edge the active area starts and the fourth is how far down the active part stretches.
To configure these you first have to work out how large the touchpad is by running the following command:
1
|
|
1 2 3 4 5 6 7 8 |
|
From this you can see that the touchpad as a horizontal range of 0-1228
and a vertical range of 0-928
. I don’t know what these numbers mean or measure, but I
played around with different values a bit and found that, for me, the magic number is 70
.
1
|
|
70
from the left1228-70 = 1168
from the left70
from the topThis setup work perfectly for me without even changing the Synaptics Palm Dimensions
. I can now type without worrying about my cursor jumping all over the place. The best part is that if you initiate a drag of the pointer in the active area of the touchpad, the touchpad will track your finger all the way to the edge, even in the ‘no touch’ zone.
To make the changes permanent put them in a script and run the file at log in time using the startup applications gui.
References:
]]>My biggest problem with Octopress is that it requires me to install and manage a Ruby environment. Either by outright installing Ruby on my machine or through rbenv. This usually means, for me at least, a struggle to get all the gems successfully installed. Adding plugins often result in errors while installing gems either due to dependencies between gem versions, or some system level dependency that is not available.
These system level dependencies really bugs me so when I recently replaced my laptop I decided to keep my OS Ruby free by managing the Octopress Ruby environment and the system level dependencies in a Docker container rather than using rbenv
TLDR; The impatient can find the Dockerfile at: https://github.com/dirkvanrensburg/octopress2-dockerfile
Thing | Version |
---|---|
OS | Ubuntu 16.04 |
Docker | 17.03.1-ce |
Octopress | 2.0 |
Github Pages to publish and host my blog and this post assumes that you are too. However, this post should be useful even if you don’t want to use Github Pages.
Now that you have a working container, it is time to do the Octopress installation. You can either start with a fresh copy of Octopress, see the documentation or with an existing Octopress blog. If you have an exising blog then you may have to tweak the Dockerfile a bit to add any system level dependencies your blog my have.
For a new blog you have a bit of a chicken and egg problem. You need to get the Octopress stuff, but you can’t run any Ruby dependent commands because Ruby is in the Docker container.
Clone Octopress and take note of the Gemfile
in the root of the repository:
1 2 |
|
You’ll need the
Gemfile
in the root of the blog repository for building the Docker image later on.
The following steps should get the blog repository in the correct state for generating and publishing.
master
to source
_deploy
folder and change into that directory_deploy
directory with the master branch of your blog repository
git init
git remote add origin <githubrepourl>
git pull origin master
You’ll need the
Gemfile
in the root of the blog repository for building the Docker image later on.
Docker gives you the ability to create a lightweight container for processes and their dependencies. You create a container from some published base image and then install the necessary packages as you would on a normal machine. You can then run the container, which will start the required process and run it without poluting the host operating system with unecessary dependencies.
A Dockerfile
is a file which tells the Docker daemon what you want in your container. How to write a Dockerfile
and what you can do with it is extensively documented here.
You basically start with a FROM
statement telling Docker where you want to start and then telling it
which package to install. In this case you have a number of dependencies as seen here:
1 2 3 4 5 6 7 8 9 10 |
|
These packages should be enough to get going with Octopress. The next step is to set up a user so that you don’t have to run the rake commands as root.
1 2 3 4 5 |
|
Next create the working folder octopress
and grant permissions to blogger to by changing ownership of the folders where you need to make changes in the future
1 2 3 4 5 6 7 8 |
|
Running rake preview
in your octopress blog folder will generate the blog and serve it on port 4000. In order to access the blog from outside the container you need to tell Docker to expose port 4000 for connections.
1 2 |
|
Next it adds the Gemfile
. The contents of this file will be custom to your blog so copy it from the blog repository as mentioned earlier. Easiest is to copy your Gemfile
to be in the same folder as the Dockerfile
since the docker ADD
command is relative to the directory you build from.
The next section will add the Gemfile
to the Docker image and install the bundles.
1 2 3 4 |
|
Then it adds your gitconfig to the image. This is necessary to provide the same git experience in or outside of the container. As with the Gemfile
you’ll have to copy your .gitconfig
file to the same folder as the Dockerfile
1
|
|
And that is it. See the repository mentioned above for the complete Dockerfile.
Everything is ready so you can now build the Docker image.
git clone git@github.com:dirkvanrensburg/octopress2-dockerfile.git octopress-dockerfile
Gemfile
from the blog repository into the same folder..gitconfig
file from your home folder into the same folderDockerfile
run the following:1
|
|
Flag | Description |
---|---|
-t | Tag the built image with that name. Later you can use the tag to start a container. |
This command instructs Docker to create a container image using the instructions in the Dockerfile
. If all goes well you should see a message saying something like this: Successfully built b847ccd963fa
To test the Docker image, start the container using the following command:
1
|
|
Flag | Description |
---|---|
–rm | Clean up by removing the contaier and its filesystem when it exits. |
-ti | Tells docker to create a pseudo TTY for the container and to keep the standard in open so you can send keystrokes to the container. |
The container will start up and your terminal should be attached and in the octopress
folder. You should see something like:
1
|
|
The exit
command will exit the container and clean up.
In order to preview the blog while working on a post, you need to change the Rakefile
in the root of the blog repository to bind the preview server to the IP wildcard 0.0.0.0
. This makes it possible to access the blog preview in your browser at http://localhost:4000
Change
1
|
|
To
1
|
|
The next step is to launch the container. Execute this command from anywhere, replacing the paths to your blog and .ssh keys:
1
|
|
Flag | Description |
---|---|
docker run | Instructs docker to run a previously built image. blog/octopress in this case |
-p 4000:4000 | Instructs docker to expose the internal (to the container) port to the host interfaces so that the host can send data to a process listening on that port in the container |
–rm | Tells docker to remove the container and its file system when it exits. We don’t need to keep the container around since the blog source is external to the image |
–volume | volume is used to mount folders on the host system into the container. This allow processes in the container to access the files as if they are local to the container. In this case two folders are mounted. The blog repository as /octopress and the local .ssh folder of the host user as /home/blogger/.ssh . The ssh keys are used by git to authenticate and encrypt traffic to and from github. Feel free to change this so that only the github keys are available in the container. |
-ti | Tells docker to create a pseudo TTY for the container and to keep the standard in open so you can send keystrokes to the container. |
blog/octopress | The name of the image to run. This is the image built earlier using docker build |
/bin/bash | The command to run when starting the container. |
Docker will start the container, create a pseudo tty, open standard in and run /bin/bash
so that your terminal is now effectively inside the container.
It is handy to place the command above in a script in the
~/bin
folder of your user. For example create a file called~/bin/blog
and place the command in there. Then you can runblog
from any terminal to immediately start and access the container.
Now run the Octopress blogging commands as you would if Ruby was installed on your local machine.
If you created a new Octopress blog then you now have to install your theme. The following installs the default Octopress theme:
1
|
|
1
|
|
Will ask for the post name and create the post file in source/_posts
To preview blog posts:
1
|
|
Then in your browser navigate to http://localhost:4000
and you should see the preview of your blog.
1
|
|
This will generate the blog into the public
folder
1
|
|
This will commit the generated blog and push it to github.
]]>In this post I’ll go through the motions of adding Hazelcast to a Spring Boot REST application and resolving the issues until we have a functioning REST service with its response cached in Hazelcast via JCache annotations.
TLDR; I suggest reading the post to understand the eventual solution, but if you are impatient see the solution on github:
* hazelcast-jcache option 1 and 2 and
* hazelcast-jcache option 3UPDATE 1: It seems that this issue will be resolved soon due to the hard work of @snicoll over at Spring Boot and the Hazelcast community. See the issues:
- https://github.com/spring-projects/spring-boot/issues/8467
- https://github.com/hazelcast/hazelcast/issues/10007
- https://github.com/hazelcast/hazelcast/pull/9973
UPDATE 2: This problem described in this post was fixed in Spring Boot release 1.5.3. Check this repository for a clean example based on Spring boot 1.5.3. I am leaving the post here since it is still interesting due to the different ways the problem could be worked around.
Dependency | Version |
---|---|
Spring Boot | 1.5.1 |
Hazelcast | 3.7.5 |
I am going to assume a working knowledge of building REST services using Spring Boot so I won’t be going into too much detail here. Building a REST service in Spring is really easy and a quick Google will bring up a couple of tutorials on the subject.
This post will build on top of a basic REST app found on github. If you clone that you should be able to follow along.
To add Hazelcast to an existing Spring Boot project is very easy. All you have to do is add a dependency on Hazelcast, provide Hazelcast configuration and start using it.
For maven add the following dependencies to your project pom.xml
file:
1 2 3 4 5 6 7 8 9 10 |
|
I left the following Hazelcast configuration empty to keep things simple for now. Hazelcast will apply defaults for all the settings if you leave the configuration empty.
You can either provide a hazelcast.xml
file on the classpath (e.g. src/main/resources
)
1 2 3 4 5 |
|
or provide a com.hazelcast.config.Config
bean by means of Spring Java configuration like this:
1 2 3 4 5 6 7 8 |
|
The hazelcast config can also be externalised from the application by passing the
-Dhazelcast.config
system property when starting the service.
Hazelcast will not start up if you start the application now. The Spring magic happens because of the
org.springframework.boot.autoconfigure.hazelcast.HazelcastAutoConfiguration
configuration class which is conditionally loaded by Spring
whenever the application context sees that:
HazelcastInstance
is on the classpathHazelcastInstance
To start using Hazelcast let’s create a special service that will wire in a Hazelcast instance. The service doesn’t do anything since it exists only to illustrate how Hazelcast is configured and started by Spring.
1 2 3 4 5 6 7 |
|
If you start the application now and monitor the logs you will see that Hazelcast is indeed starting up. You should see something like:
[LOCAL] [dev] [3.7.5] Prefer IPv4 stack is true.
[LOCAL] [dev] [3.7.5] Picked [192.168.1.1]:5701, using socket ServerSocket[addr=/0:0:0:0:0:0:0:0,localport=5701], bind any local is true
[192.168.1.1]:5701 [dev] [3.7.5] Hazelcast 3.7.5 (20170124 - 111f332) starting at [192.168.1.1]:5701
[192.168.1.1]:5701 [dev] [3.7.5] Copyright (c) 2008-2016, Hazelcast, Inc. All Rights Reserved.
[192.168.1.1]:5701 [dev] [3.7.5] Configured Hazelcast Serialization version : 1
and a bit further down:
Members [1] {
Member [192.168.1.1]:5701 - f7225da2-a428-4849-944f-43abfb12063a this
}
This is great! Hazelcast running with almost no effort at all!
Next we want to start using Hazelcast as a JCache provider. To do this add a dependency on spring-boot-starter-cache
in your pom file.
1 2 3 4 |
|
Then, in order to use the annotations, add a dependency on the JCache API
1 2 3 4 |
|
Finally to tell Spring to now configure caching add the @EnableCaching
annotation to the Spring boot application class. The Spring boot application class is the one
that is currently annotated with @SpringBootApplication
1 2 3 |
|
Now something unexpected happens. Starting the application creates two hazelcast nodes which, if your local firewall allows multicast, join up to form a cluster. If multicasting works then you should see the following:
Members [2] {
Member [192.168.1.1]:5701 - 18383f04-43ac-41fc-a2bc-cd093a9706b6 this
Member [192.168.1.1]:5702 - b654cb85-7b59-489d-b599-64ddd2dc0730
}
2017-02-16 08:41:46.154 INFO 14141 --- [ration.thread-0] c.h.internal.cluster.ClusterService : [192.168.1.1]:5702 [dev] [3.7.5]
Members [2] {
Member [192.168.1.1]:5701 - 18383f04-43ac-41fc-a2bc-cd093a9706b6
Member [192.168.1.1]:5702 - b654cb85-7b59-489d-b599-64ddd2dc0730 this
}
This is saying that there are two Hazelcast nodes running; One on port 5701
and another on port 5702
and they have joined to form a cluster.
This is an unexpected complication, but lets ignore the second instance for now.
Let’s see if the caching works. Firstly we have to provide some cache configuration. Add the following to the hazelcast.xml
file.
1 2 3 4 5 6 7 |
|
Next, to start caching change the sum
function in the CalculatorService
to:
1 2 3 4 5 6 7 |
|
line 1
we added the @CacheResult
annotation to indicate that we want to cache the result of this function and want to place them in the cache called sumCache
line 4
we print a message to standard out so we can see the caching in actionStart the application and call the CalculatorService
to add two numbers together. You can use curl
or simply navigate to the following URL in a browser window
http://localhost:8080/calc/200/plus/100
Note: The port could be something other than 8080. Check the standard out when starting the application for the correct port number
You’ll get the following response
{"result":300.0}
and should see this output in standard out:
******> Calculating 200.0 + 100.0
Subsequent calls to the service will not print this line, but if you try again after a minute you’ll see the message again.
So caching works! But what about the second HazelcastInstance ?
So you may think that the second Hazelcast instance is due to the example MapService
we added earlier. To test that we can disable it by commenting the @Service
annotation.
You can even delete the class if you like, but the application will still start two Hazelcast nodes.
My guess as to what is going on is: When the application context starts, a Hazelcast instance is created by the JCache configuration due to the
@EnableCaching
annotation but this instance is not registered with the Spring context. Later on a new instance is created by the HazelcastAutoConfiguration
which is managed by Spring and can be injected into other components.
I have found two solutions to the ‘two instance problem’ so far. Each with its own drawbacks
I got the following idea from Neil Stevenson over on stackoverflow.
1 2 3 4 |
|
Drawback: You can’t use the Hazelcast instance created this way directly. Spring has no knowledge of it, so you can’t get it wired in anywhere.
This as the same effect as option 1 above except that you can use the instance. You have to name the hazelcast instance in the config:
<instance-name>test</instance-name>
and then tell the Spring context to use it by getting it by name:
1 2 3 4 |
|
Drawback: This relies on the order of bean creation so I can only say that it works in Spring Boot 1.5.1.
The best solution so far is to set and instance name as in Option 2 above and then setting the spring.hazelcast.config=hazelcast.xml
in the application.properties
file.
I personally think that option 3 is the best approach. That gives you the best of both worlds with minimum configuration.
Spring Boot can be a bit magical at times and doesn’t always do exactly what you would expect, but there is always a way to tell it to get out of the way and do it yourself. The people over at Spring are working hard to make everything ‘just work’ and I am confident that these things will be ironed out over time.
]]>I recently learned that my understanding of what causes a NaN
value in Java’s double
was wrong.
I was working on an integration project and received a bug report on one of my services. The report said that my service is returning an HTTP code ‘500’ for a specific input message.
During my investigation I found the cause of the exception was an unexpected value returned from a down stream service. It was a SOAP service which returned something like the following in its XML response:
<SomeNumberField type="number">NaN</SomeNumberField>
I was a bit surprised to see the NaN
there since I would expect them to either leave the field off or set it to null
if they don’t have a value. This looked like a calculation bug since we all know that, in Java and C# at least, dividing a double with 0 results in a NaN
. (Spoiler: It doesn’t)
However, this got me thinking and I tried to remember what I know about double
and NaN
. This resulted in an embarrisingly deep spiral down the rabbit hole.
Well if you think about it NaN
is kind of like a number in this case, even though NaN means Not-a-Number. It exists to enable calculations with indeterminate results to be represented as a “number” in the set of valid double
values. Without NaN
you could get completely wrong results or you’ll get an exception, which isn’t ideal either. NaN
is defined, same as Infinity
, to be part of the set of valid doubles.
System.out.println(Double.isNaN(Double.NaN)); //true
System.out.println(Double.POSITIVE_INFINITY == Double.POSITIVE_INFINITY); //true
System.out.println(Double.NEGATIVE_INFINITY == Double.NEGATIVE_INFINITY); //true
I played around with double
a bit and I thought to share it in a post, because I think the various edge cases of double
are interesting.
I started with the following experiment:
//Lets make a NaN!
double NaN = 5.0/0;
System.out.println("NaN: " + NaN);
>> NaN: Infinity
Wait. What?
Turns out that I have lived with this misconception about what happens when you divide a double by zero. I seriously expected that a double
divided by 0 is NaN
. Well it turns out I was wrong. You get:
POSITIVE_INFINITY
double infinity = 5.0/0;
System.out.println((infinity == Double.POSITIVE_INFINITY)); //true
I can sort of rationalise that the answer could be infinity because you are dividing something largish with something much much smaller. In fact, dividing it by nothing so you could argue the result of that should be infitely large. Although, mathematically this does not make any sense. x/0 is undefined since there is no number that you can multiply with 0 to get back to x again. (for x <> 0)
Anyway lets play with NaN
a bit.
double NaN = Double.NaN;
System.out.println("NaN: " + NaN); //NaN: NaN
System.out.println((NaN + 10)); //(NaN + 10): NaN
System.out.println((NaN - 10)); //(NaN - 10): NaN
System.out.println((NaN - NaN)); //NaN - NaN: NaN
System.out.println((NaN / 0)); //NaN / 0: NaN
System.out.println((NaN * 0)); //NaN * 0: NaN
Well no surprises here. Once a NaN always a NaN.
I used
Double.NaN
above to be sure I have aNaN
but if you want to make one yourself then calculating the square root of a negative number is an easy way:
System.out.println((Math.sqrt(-1))); //NaN
Before we get to infinity let take a quick look at Double.MAX_VALUE
and Double.MIN_VALUE
. These are special constants defined on Double
which you can use to check if a number is at the maximum of what a double can represent. If a number is equal to Double.MAX_VALUE
it means that it is about to overflow into Double.POSITIVE_INFINITY
. The same goes for Double.MIN_VALUE
except that it will overflow to Double.NEGATIVE_INFINITY
.
Something to note about double
is that it can represent ridiculously large numbers using a measly 64 bits. The maximum value is larger than 1.7*10^308
!
System.out.println("Double.MAX_VALUE is large! : " + (Double.MAX_VALUE == 1.7976931348623157 * Math.pow(10,308)));
> Double.MAX_VALUE is large! : true
It can represent these large numbers because it encodes numbers as a small real number multiplied by some exponent. See the IEEE spec
Let’s see what it takes to make Double.MAX_VALUE
overflow to infinity.
double max = Double.MAX_VALUE;
System.out.println((max == (max + 1))); //true
System.out.println((max == (max + 1000))); //true
System.out.println("EVEN...");
System.out.println((max == (max + Math.pow(10,291)))); //true
System.out.println("HOWEVER...");
System.out.println((max == (max + Math.pow(10,292)))); //false
System.out.println((max + Math.pow(10,292))); //Infinity
This ability to represent seriously large numbers comes at a price of accuracy. After a while only changes in the most significant parts of the number can be reflected. As seen in the following code snippet:
double large_num = Math.pow(10,200);
System.out.println("large_num == (large_num + 1000): " + (large_num == (large_num + 1000))); //true
At large integer values the steps between numbers are very very large since the double has no place to record the change if it doesn’t affect its most 16 most significant digits. As shown above 1000 plus a very large number is still that same very large number.
Java’s double
supports two kinds of infinity. Positive and negative inifity. The easiest to make those are by dividing by 0.
double pos_infinity = 5.0/0;
System.out.println("POSITIVE_INFINITY == pos_infinity: " + (Double.POSITIVE_INFINITY == pos_infinity));
double neg_infinity = -5.0/0;
System.out.println("NEGATIVE_INFINITY == neg_infinity: " + (Double.NEGATIVE_INFINITY == neg_infinity));
In maths infinity is a numerical concept representing the idea of an infinitly large number. It is used, for example in calculus, to describe an unbounded limit - some number that can grow without bound.
In this case things are pretty much the same as in maths, where POSITIVE_INFINITY and NEGATIVE_INFINITY are used to represent numbers that
are infinitely large. However they function more as a way to know something went wrong in your calculation. You are either trying to calculate something that is too large to store in a double
or there is some bug in the code.
There are once again some interesting things to note when playing with positive and negative infinity.
double pos = Double.POSITIVE_INFINITY;
System.out.println("POSITIVE_INFINITY + 1000 = " + (pos + 1000));
System.out.println("POSITIVE_INFINITY + 10^1000 = " + (pos + Math.pow(10,1000)));
System.out.println("POSTIVE_INFINITY * 2 = " + (pos * 2));
Once the value is infinity it stays there even if you add or substract rediculously large numbers. However there is one interesting case, when you substract infinity from infinity:
double pos = Double.POSITIVE_INFINITY;
double neg = Double.NEGATIVE_INFINITY;
System.out.println("POSITIVE_INFINITY - POSITIVE_INFINITY = " + (pos - pos));
System.out.println("POSITIVE_INFINITY + NEGATIVE_INFINITY = " + (pos + neg));
Subtracting infinity from infinity yields NaN
and as you would expect adding or subtracting NaN
yields a NaN
again.
System.out.println("POSTIVE_INFINITY + NaN" + (pos + Double.NaN));
System.out.println("POSTIVE_INFINITY - NaN" + (pos - Double.NaN));
Both Java’s float
and double
types follow the IEEE 754-1985 standard for representing floating point numbers. I am not going to go into great detail on the internals of double
, but it suffice to say that double
and float
are not perfectly accurate when you use them to perform arithmetic. The Java primitive type documentation says:
This data type should never be used for precise values, such as currency. For that, you will need to use the java.math.BigDecimal class instead.
If precision is you main concern then it is generally better to stick with good old java.math.BigDecimal
. BigDecimal is immutable which makes it nice to work with, but the most important thing is precision. You have absolute control over number precision, without the rounding or overflow surprises you get with double
and float
. However, if performance is the main concern it is better to stick with float
or double
and live with the inaccuracies.
For more information on how Java handles NaN, infinity and rouding read the documentation here.
]]>Some time ago, I was tasked to replicate one of our client’s Wily Introscope dashboards in AppDynamics. The Wily dashboard displayed a number of status lights indicating how recently activity was detected from a particular client of the application.
The status light colours were assigned as follows:
Status | Meaning |
---|---|
GREY | No activity since 5am this morning |
RED | No activity in the last hour, but something since 5 am |
YELLOW | No activity in the last 10 minutes, but some in the last hour |
GREEN | Activity in the last 10 minutes |
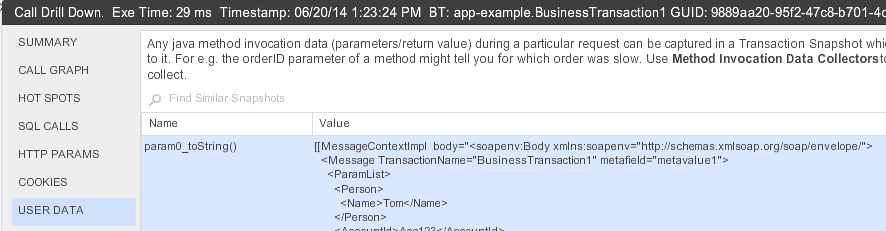
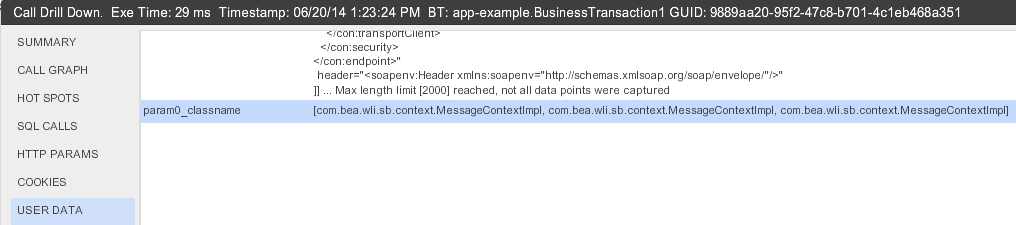
The data for each light was gathered by Introscope using custom instrumentation points looking for calls to a particular POJO method. The first parameter to this method was the client identifier, so Introscope collected metrics for each call to this method grouping it by 10 minutes, 1 hour and 1 day.
In this post I will describe what I did to reproduce the dashboard in AppDynamics. Even though it is a rather hacky work around, it is still interesting. The solution works by extracting metrics from AppDynamics using the REST API and sending it back in as new metrics, which can be used by health rules to drive status lights.
The code and examples in this post is from an example application built to illustrate the solution more clearly.
See github: https://github.com/dirkvanrensburg/blogs-appd-metrics-for-dashboards
The status light in AppDynamics relies on a health rule to drive the state of the light. The AppDynamics status light is green by default, to indicate no health rule violations. Yellow for WARNING rule violations and Red for CRITICAL rule violations. The status light in Introscope is grey when there is no data, so it essentially has four states compared to the three states available in AppDynamics.
As mentioned, the AppDynamics status light uses one health rule, which means you cannot tie the different colours of the light to metrics gathered over different time ranges. The time range for the light is determined by the setting on the widget or the dashboard, where the Introscope status light can use separate metrics for each status.
The first step to solving the problem is to gather the information we need to display. We can look at the Introscope probe configuration to see what it uses for for the status light:
TraceOneMethodWithParametersOfClass: SomeCentralClass loadItems(Ljava/lang/String;)V BlamedMethodRateTracer "SYS|Service By Client|{0}:Invocations Per Second"
This means that Introscope will count the invocations per second of a method called loadItems, on an instance of the class SomeCentralClass and group this count by the client identifier (the String parameter to loadItems).
To capture that type of information in AppDynamics you use information points. Information points tracks calls to a method on a POJO and collects metrics such as Calls Per Minute and Average Response Time. AppDynamics does not allow information points to be “split” by parameter in a generic way. That means to get the required information, we have to create an information point for every client.
You create information points by opening the Information Points view from the side menu and clicking on New
Analyse -> Information Points -> New
Information points track calls to specific methods so you need to provide the class name, method name of the method to collect metrics for. In this case we want separate informations points based on the parameter to the method call, so we need to set a match condition
The information point will then start collecting data for Average Response Time, Calls per minute, and Errors per minute as seen on the following dashboard view.
Once defined, the information points are also available in the metric browser where you can plot the different metrics of each information point on the same graph. The following image shows the Average Response Time for CLIENT2 and CLIENT4
Analyse -> Metric Browser
The AppDynamics controller provides a REST API, which enables you to programmatically extract information out of the controller and, in the case of configuration, send information to the controller. This means that we can call the controller to get the metric information of the information points we just configured. The URL to an information point metric can be retrieved from the metric browser. Right click on the information point and the metric you are interested in, Calls per Minute in our case, and select Copy REST URL
This will copy the URL to the clipboard and you can test it by pasting it into a new tab in your web browser. You should see something like this
The URL can be changed to get the information over different time ranges by changing the time-range-type and duration-in-mins fields. The time-range-type field is used to get information relative to a point in time, so for example it can be used to get information for the last 15 minutes or for the 30 minutes after 10 am this morning. We can use this to get the information we are after out of AppDynamics. We can get the number of times each client called the service in the last 10, 60 or 960 minutes by changing these fields and calling the controller.
Having the information available as a REST service call is one thing, but we need it in the controller so we can create a dashboard. It is of no real use on the outside. To get metrics into the controller we need to use the Standalone Machine Agent.
The Standalone Machine Agent is a Java application whose primary function is to monitor machine statistics such as CPU, Memory utilisation and Disk IO. It also provides a way to send metrics into AppDynamics by means of a Monitoring Extension. The extension can supplement the existing metrics in AppDynamics by sending your custom metrics to the controller. A custom metric can be common across the nodes or associated with a specific tier. You specify the path, as seen in the metric browser, where the metrics should be collected relative to the root Custom Metrics
As mentioned before the metrics we are interested in can be extracted from the AppDynamics controller using the REST API and using the Standalone Machine Agent we can create new metrics, which we can use for the dashboard. Using the following REST API call, we can get the metrics captured by our information points rolled up to the different time ranges. The call below will get the Calls per Minute metric of CLIENT1
http://controller:8090/controller/rest/applications/ComplexDashboardTest/metric-data?metric-path=Information Points|C1|Calls per Minute&time-range-type=BEFORE_NOW&duration-in-mins=10
By calling the above REST call multiple times for every client we can get values for Calls per Minute rolled up over the periods we are interested in (10, 60 and 960 minutes). However, just getting the values of the last 960 minutes (16 hours) is not good enough since it will give incorrect values early in the day. Before 13h00 it could still pick up calls from the previous day, so we need a different approach. To do this we change the time-range-type to AFTER_TIME and provide a start time of 5am the morning. This will then only return values for the 960 minutes after 5am.
The following REST call will do that - replace the ${timeat5am} value with the UNIX time for 5am of that day.
http://controller:8090/controller/rest/applications/ComplexDashboardTest/metric-data?metric-path=Information Points|C1|Calls per Minute&time-range-type=AFTER_TIME&start-time=${timeat5am}000&duration-in-mins=960
To send the information back in we need to actually create the monitoring extension, which essentially is a script which the Standalone machine agent will call periodically and any values the script writes to standard output will be forwarded to the controller. We want the script to send metrics such as the following:
name=Custom Metrics|Information Points|CLIENT1|Calls per 10 Minutes,value=0
name=Custom Metrics|Information Points|CLIENT1|Calls per 60 Minutes,value=2
name=Custom Metrics|Information Points|CLIENT1|Calls per 960 Minutes,value=2
name=Custom Metrics|Information Points|CLIENT2|Calls per 10 Minutes,value=0
name=Custom Metrics|Information Points|CLIENT2|Calls per 60 Minutes,value=1
name=Custom Metrics|Information Points|CLIENT2|Calls per 960 Minutes,value=3519
...And so on for all the clients
Once we have the extension installed and reporting, the new metrics will show up in the AppDynamics metric browser at the following location, assuming the machine agent is reporting for the tier called ‘OneTier’.
Application Infrastructure Performance -> OneTier -> Custom Metrics
There will be a section for each client (CLIENT1 to CLIENTx) and each will have a metric for each of the time ranges we are interested in (10, 60 and 960 minutes)
Health Rules provides a way to specify conditions which the system will consider WARNING or CRITICAL conditions. You specify the metric to monitor and the threshold or baseline to compare it to for both the WARNING and CRITICAL condition.
We can now create health rules to track these metrics, so that the dashboard lights can show how recently a particular client accessed the system. To create a health rule we use the side menu in the AppDynamics controller.
Alert & Response -> Health Rules -> (click on +)
First specify a name for the rule, the type of metric we will use and the time range to use when evaluating the health rule. The last 5 minutes is good enough since the machine agent will send a value every minute and the value it sends is already summed over the period in question.
We need to create one health rule for every client
The WARNING condition is raised if there were no calls in the last 10 minutes, but some in the last 60 minutes.
The CRITICAL condition is raised if there were no calls in the last 60 minutes.
Now we have all the information we need to start assembling the dashboard. Status lights only work on Custom Dashboard as opposed to Node/Tier Dashboards. To create a Custom Dashboard we click on the AppDynamics logo at the left top an choose Custom Dashboards
Next we create a new dashboard by clicking on the Create Dashboad and set the layout of the canvas to absolute. This is because the grid layout does not support metric labels on top of other widgets and we need this to complete the dashboard.
Put a label with the text Client Access and place it at the top of the dashboard, add a label for the first status light with the text CLIENT 1 and then add the status light for client 1. The status light is linked to the health rule for CLIENT1 by selecting it in the status light properties.
We can now repeat these steps for the remaining 5 clients, linking each to the appropriate health rule, and finally the dashboard looks like this
As mentioned at the start of the post, the Introscope status light can be in four states and the AppDynamics status light only three. To represent the fourth state we can put the value of the Calls per 960 Minutes metric on the status light as a dynamic label.
The label background is set as transparent, and sized so that it will fit on the status light for client 1. After adding a metric label for each client, the dashboard is complete. We now have a fully functional dashboard which displays the same information as the original Introscope dashboard. In fact, it shows a little more information because we added the ‘calls today’ label on the status to make up for the missing fourth state. Knowing the number of calls for the day is much better than just having a red light meaning ‘some calls today but nothing in the last hour’.
Using the AppDynamics REST API and Standalone Machine Agent allows you to do powerful enrichment of the metric information in AppDynamics. You could, for example, monitor an internal legacy system through a custom built API and combine that data with information already captured by AppDynamics. This can then be stored as a new metric which you can use to visualise the data.
]]>We recently helped a customer configure AppDynamics to monitor their business transactions on Oracle OSB. AppDynamics does not have built-in support for Oracle OSB, although it does support Weblogic Application Server. It detected various business transactions out of the box, but one type of transaction in particular proved to be a little tricky.
The OSB was accepting SOAP messages from a proprietary upstream system all on one endpoint. It then inspected the message and called one or more services on the OSB, essentially routing the incoming messages. AppDynamics grouped all these messages as one business transaction because they all arrived at the same endpoint. This was not acceptable as a significant number of distinct business transactions were processed this way. We had to find a way to separate the business transaction using the input data.
Changing the application was not an option so, we solved this by augmenting the application server code to give AppDynamics an efficient way to determine the business transaction name. The rest of this article describes how AppDynamics was used to find a solution, and how we improved the solution using custom byte code injection.
An example OSB application which reproduces the design of the actual application is used to illustrate the problem and solution.
It is a bit tricky to find the business transactions for this application because the services on Oracle OSB are all implemented by configuring the same Oracle classes. Each Proxy Service is just another instance of the same class and the call graph in the transaction snapshot is full of generic sounding names like ‘AssignRuntimeStep’
The first step to figuring out how to separate the business transactions is using the AppDynamics Method Invocation Data Collector feature. This gives you a way to inspect the method parameters in the call and printing their values. Method invocation data collectors allows you to configure AppDynamics to capture the value of a parameter for a particular method invocation. Not only the value of the parameter but it is possible to apply a chain of get- methods to the parameter.
The following figure shows data collector configuration to get information out of the parameters passed to the processMessage method on the AssignRuntimeStep class we noticed in the call graph. This data collector tells AppDynamics to capture the first parameter to the processMessage method on the class AssignRuntimeStep and then to collect the result of calling toString() and getClass().getName() on that parameter.
The results of this can be seen in the following images. The first shows the result of the toString() applied to the first parameter
and the second shows the class of the parameter. Notice that the class name is repeated three times. It is a list of values, one value saved for every invocation of the processMessage method.
From the first image it is obvious that the input message is contained in the first parameter. You can also see that the messages is stored in a map like structure and the key is called body. Note that the business transaction name is visible in the first image TranactionName=“Business Transaction1”. The second image shows the type of the first parameter so the message is contained in an object of class MessageContextImpl.
The next step is to tell AppDynamics what to use for splitting the business transactions and this can be done by using a Business Transaction Match Rule. The number of characters from the start of the message to the field we are interested in are roughly 126 and assuming the transaction names will be around 20 characters we can set up a match rule as follows:
Note the number of arguments (2) set in the above image. That value is important and the transactions will not show up at all if the wrong value is used. We determined the value by decompiling the Weblogic class but you can always do it by first trying 1 and then 2.
With the above configuration in place the AppDynamics agent is able to pick up the different transactions. The transaction names aren’t perfect but it works!
This solution is OK, but it has a few issues. Firstly the transaction names are either cut off or include characters that are not part of the transaction name. It is also not very efficient, because it requires the entire MessageContextImpl instance to be serialised as a String just to extract a small part of it. To improve this we need to add custom code to the MessageContextImpl class so that we can access the data in a more efficient way.
Consider the following Java code to search a string for the transaction name:
1 2 3 4 5 6 7 8 9 10 11 12 13 14 15 16 17 18 19 |
|
This is a statically accessible piece of code that will extract the transaction name from an arbitrary string. It first tries to find the token in the input string. Once the token is found it determines the open and end quote positions and returns the transaction name. If nothing is found then return null.
The next step is to write some Java code that can use the above code without loading the entire string into memory.
1 2 3 4 5 6 7 8 9 10 11 12 13 14 15 16 17 18 19 20 21 22 23 24 25 26 27 28 29 30 31 32 33 34 35 36 37 38 39 |
|
This method accepts an InputStream and progressively reads it, 256 characters at a time, to find the transaction type. It is limited to search only the first 512 characters as an optimisation based on the known message structure. It will likely always find the transaction type within the first 256 characters, but 512 makes it a certainty. Also note the variables WITHIN and BUFFER_SIZE, which are there to make the code configurable and future proof.
The code listed above can be included in a custom Java agent that will instrument the Weblogic code using a ClassFileTransformer. Creating Java agents and class transformers are out of the scope of this article. It focuses on the bits actually injected. For more on creating a custom Java agent see the java.lang.instrument documentation.
The next step is making the above getTransactionType accessible by the AppDynamics agent.
Byte code injection can be achieved in different ways, one way is using the ASM library. The basic idea is to inject a method into the MessageContextImpl class that can be accessed by AppDynamics as a getter on the first parameter of the processMessage method of AssignRuntimeStep.
So for the agent to inject the following piece of code into the MessageContextImpl class,
1 2 3 4 5 6 7 8 9 |
|
you can use ASM as listed below. It effectively writes the above method into the MessageContextImpl class before it is loaded by the class loader. For more information on how to use ASM see the ASM User Guide.
1 2 3 4 5 6 7 8 9 10 11 12 13 14 15 16 17 18 19 20 21 22 23 24 25 26 27 28 29 30 31 32 33 34 35 36 37 38 39 40 41 42 |
|
Now the AppDynamics agent configuration can be updated to use the new ec_getTransType method.
The resulting business transaction names now looks much better.
With AppDynamics it is possible to get really useful information out of a running application. It has very flexible configuration, which allows you to really dive deep into the application internals to find issues and separate transactions. However, sometimes it is better to give AppDynamics a hook into the internal information so that it can work more efficiently. When you have access to the application code then this can easily be achieved by adding some code. When it is not practical to rebuild the entire application then you can always use byte code injection.
]]>