Overview
Some time ago, I was tasked to replicate one of our client’s Wily Introscope dashboards in AppDynamics. The Wily dashboard displayed a number of status lights indicating how recently activity was detected from a particular client of the application.

The status light colours were assigned as follows:
| Status | Meaning |
|---|---|
| GREY | No activity since 5am this morning |
| RED | No activity in the last hour, but something since 5 am |
| YELLOW | No activity in the last 10 minutes, but some in the last hour |
| GREEN | Activity in the last 10 minutes |
The data for each light was gathered by Introscope using custom instrumentation points looking for calls to a particular POJO method. The first parameter to this method was the client identifier, so Introscope collected metrics for each call to this method grouping it by 10 minutes, 1 hour and 1 day.
In this post I will describe what I did to reproduce the dashboard in AppDynamics. Even though it is a rather hacky work around, it is still interesting. The solution works by extracting metrics from AppDynamics using the REST API and sending it back in as new metrics, which can be used by health rules to drive status lights.
The code and examples in this post is from an example application built to illustrate the solution more clearly.
See github: https://github.com/dirkvanrensburg/blogs-appd-metrics-for-dashboards
Status lights in AppDynamics
The status light in AppDynamics relies on a health rule to drive the state of the light. The AppDynamics status light is green by default, to indicate no health rule violations. Yellow for WARNING rule violations and Red for CRITICAL rule violations. The status light in Introscope is grey when there is no data, so it essentially has four states compared to the three states available in AppDynamics.
As mentioned, the AppDynamics status light uses one health rule, which means you cannot tie the different colours of the light to metrics gathered over different time ranges. The time range for the light is determined by the setting on the widget or the dashboard, where the Introscope status light can use separate metrics for each status.
Getting the information
The first step to solving the problem is to gather the information we need to display. We can look at the Introscope probe configuration to see what it uses for for the status light:
TraceOneMethodWithParametersOfClass: SomeCentralClass loadItems(Ljava/lang/String;)V BlamedMethodRateTracer "SYS|Service By Client|{0}:Invocations Per Second"
This means that Introscope will count the invocations per second of a method called loadItems, on an instance of the class SomeCentralClass and group this count by the client identifier (the String parameter to loadItems).
Information points
To capture that type of information in AppDynamics you use information points. Information points tracks calls to a method on a POJO and collects metrics such as Calls Per Minute and Average Response Time. AppDynamics does not allow information points to be “split” by parameter in a generic way. That means to get the required information, we have to create an information point for every client.
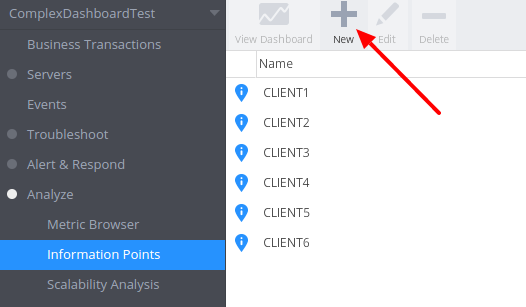
You create information points by opening the Information Points view from the side menu and clicking on New
Analyse -> Information Points -> New
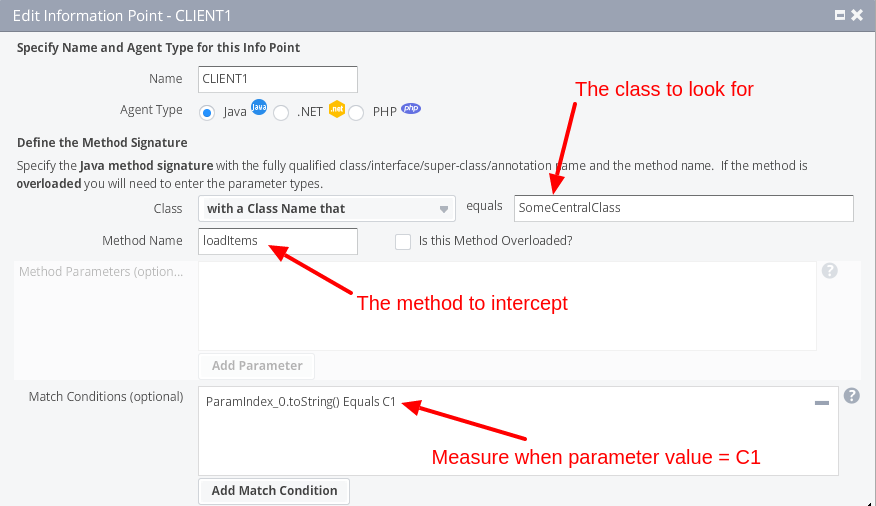
Information points track calls to specific methods so you need to provide the class name, method name of the method to collect metrics for. In this case we want separate informations points based on the parameter to the method call, so we need to set a match condition
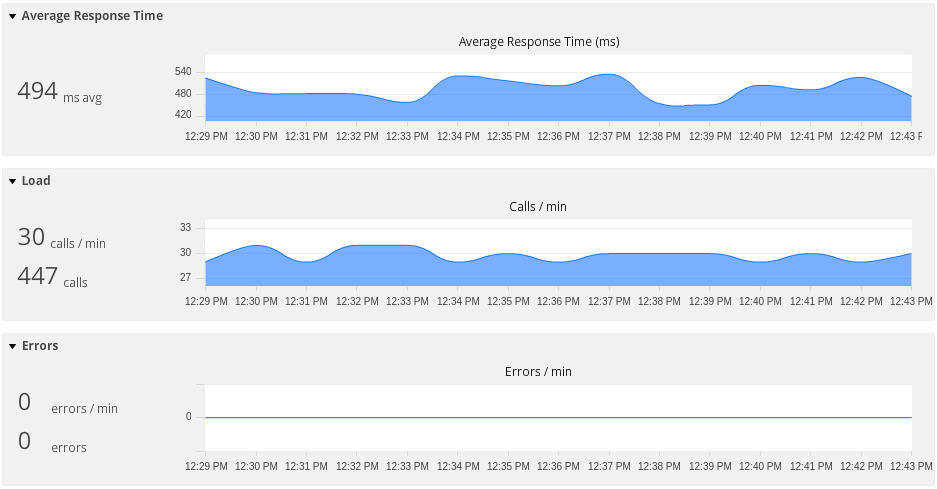
The information point will then start collecting data for Average Response Time, Calls per minute, and Errors per minute as seen on the following dashboard view.
Once defined, the information points are also available in the metric browser where you can plot the different metrics of each information point on the same graph. The following image shows the Average Response Time for CLIENT2 and CLIENT4
Analyse -> Metric Browser

Using the REST API
The AppDynamics controller provides a REST API, which enables you to programmatically extract information out of the controller and, in the case of configuration, send information to the controller. This means that we can call the controller to get the metric information of the information points we just configured. The URL to an information point metric can be retrieved from the metric browser. Right click on the information point and the metric you are interested in, Calls per Minute in our case, and select Copy REST URL
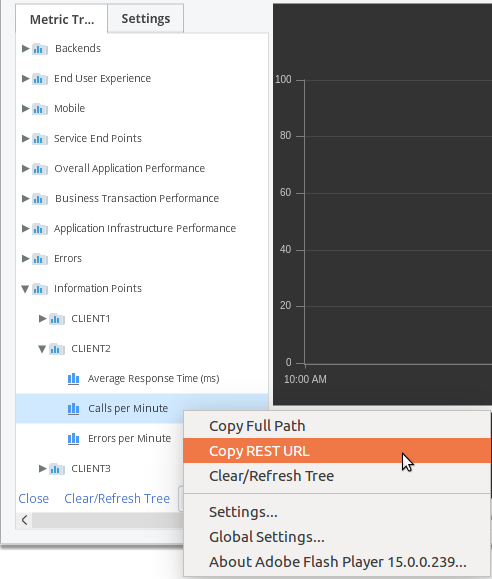
This will copy the URL to the clipboard and you can test it by pasting it into a new tab in your web browser. You should see something like this
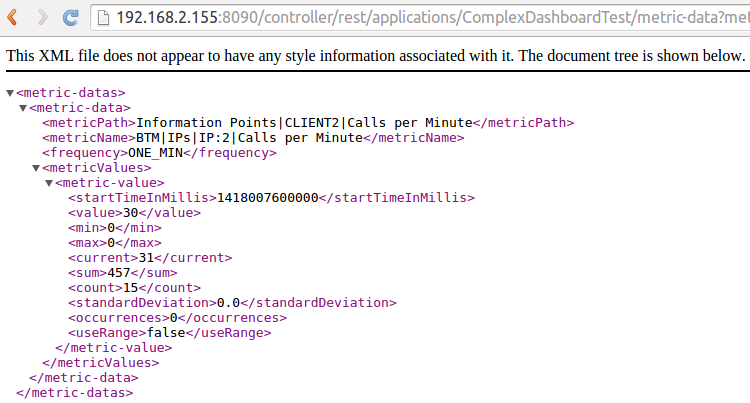
The URL can be changed to get the information over different time ranges by changing the time-range-type and duration-in-mins fields. The time-range-type field is used to get information relative to a point in time, so for example it can be used to get information for the last 15 minutes or for the 30 minutes after 10 am this morning. We can use this to get the information we are after out of AppDynamics. We can get the number of times each client called the service in the last 10, 60 or 960 minutes by changing these fields and calling the controller.
Having the information available as a REST service call is one thing, but we need it in the controller so we can create a dashboard. It is of no real use on the outside. To get metrics into the controller we need to use the Standalone Machine Agent.
The Standalone Machine Agent
The Standalone Machine Agent is a Java application whose primary function is to monitor machine statistics such as CPU, Memory utilisation and Disk IO. It also provides a way to send metrics into AppDynamics by means of a Monitoring Extension. The extension can supplement the existing metrics in AppDynamics by sending your custom metrics to the controller. A custom metric can be common across the nodes or associated with a specific tier. You specify the path, as seen in the metric browser, where the metrics should be collected relative to the root Custom Metrics
Get the information out
As mentioned before the metrics we are interested in can be extracted from the AppDynamics controller using the REST API and using the Standalone Machine Agent we can create new metrics, which we can use for the dashboard. Using the following REST API call, we can get the metrics captured by our information points rolled up to the different time ranges. The call below will get the Calls per Minute metric of CLIENT1
http://controller:8090/controller/rest/applications/ComplexDashboardTest/metric-data?metric-path=Information Points|C1|Calls per Minute&time-range-type=BEFORE_NOW&duration-in-mins=10
By calling the above REST call multiple times for every client we can get values for Calls per Minute rolled up over the periods we are interested in (10, 60 and 960 minutes). However, just getting the values of the last 960 minutes (16 hours) is not good enough since it will give incorrect values early in the day. Before 13h00 it could still pick up calls from the previous day, so we need a different approach. To do this we change the time-range-type to AFTER_TIME and provide a start time of 5am the morning. This will then only return values for the 960 minutes after 5am.
The following REST call will do that - replace the ${timeat5am} value with the UNIX time for 5am of that day.
http://controller:8090/controller/rest/applications/ComplexDashboardTest/metric-data?metric-path=Information Points|C1|Calls per Minute&time-range-type=AFTER_TIME&start-time=${timeat5am}000&duration-in-mins=960
Send the information back in
To send the information back in we need to actually create the monitoring extension, which essentially is a script which the Standalone machine agent will call periodically and any values the script writes to standard output will be forwarded to the controller. We want the script to send metrics such as the following:
name=Custom Metrics|Information Points|CLIENT1|Calls per 10 Minutes,value=0
name=Custom Metrics|Information Points|CLIENT1|Calls per 60 Minutes,value=2
name=Custom Metrics|Information Points|CLIENT1|Calls per 960 Minutes,value=2
name=Custom Metrics|Information Points|CLIENT2|Calls per 10 Minutes,value=0
name=Custom Metrics|Information Points|CLIENT2|Calls per 60 Minutes,value=1
name=Custom Metrics|Information Points|CLIENT2|Calls per 960 Minutes,value=3519

...And so on for all the clients
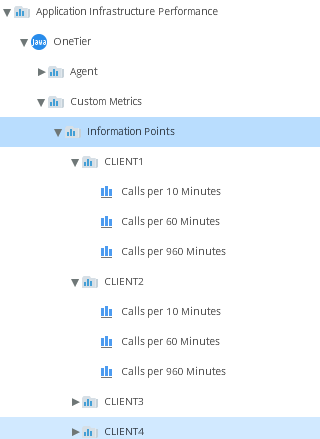
Once we have the extension installed and reporting, the new metrics will show up in the AppDynamics metric browser at the following location, assuming the machine agent is reporting for the tier called ‘OneTier’.
Application Infrastructure Performance -> OneTier -> Custom Metrics
There will be a section for each client (CLIENT1 to CLIENTx) and each will have a metric for each of the time ranges we are interested in (10, 60 and 960 minutes)
Health Rules
Health Rules provides a way to specify conditions which the system will consider WARNING or CRITICAL conditions. You specify the metric to monitor and the threshold or baseline to compare it to for both the WARNING and CRITICAL condition.
We can now create health rules to track these metrics, so that the dashboard lights can show how recently a particular client accessed the system. To create a health rule we use the side menu in the AppDynamics controller.
Alert & Response -> Health Rules -> (click on +)
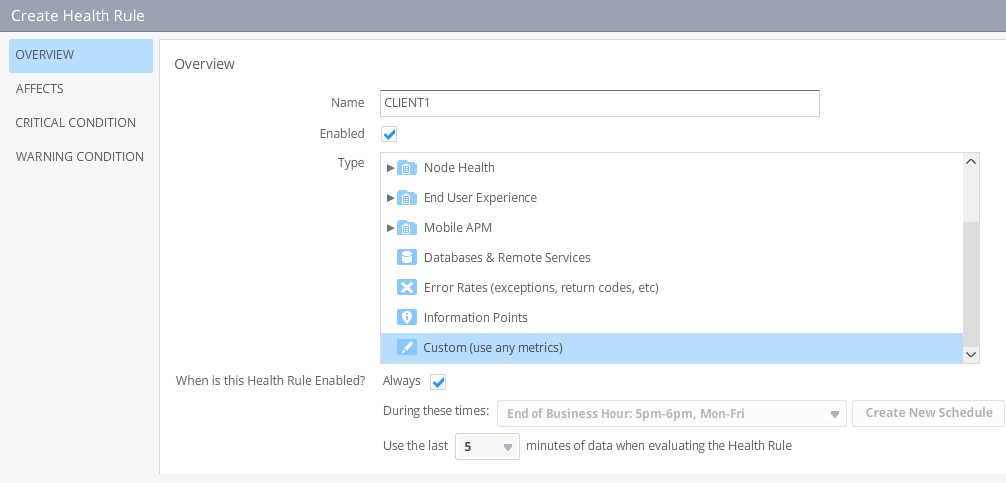
First specify a name for the rule, the type of metric we will use and the time range to use when evaluating the health rule. The last 5 minutes is good enough since the machine agent will send a value every minute and the value it sends is already summed over the period in question.
We need to create one health rule for every client
The WARNING condition is raised if there were no calls in the last 10 minutes, but some in the last 60 minutes.
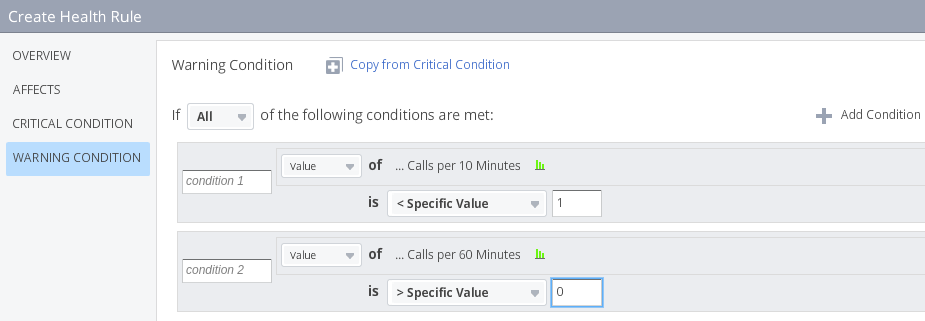
The CRITICAL condition is raised if there were no calls in the last 60 minutes.

Putting it all together
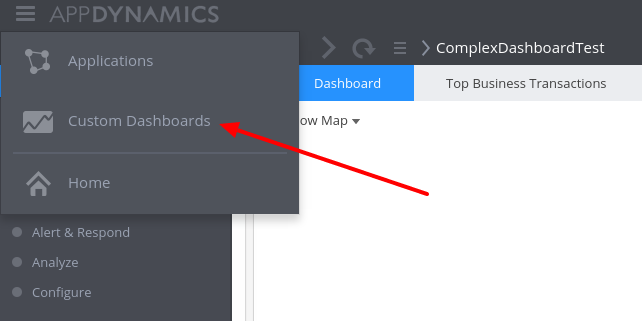
Now we have all the information we need to start assembling the dashboard. Status lights only work on Custom Dashboard as opposed to Node/Tier Dashboards. To create a Custom Dashboard we click on the AppDynamics logo at the left top an choose Custom Dashboards
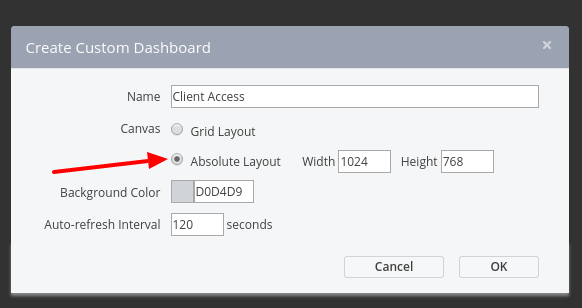
Next we create a new dashboard by clicking on the Create Dashboad and set the layout of the canvas to absolute. This is because the grid layout does not support metric labels on top of other widgets and we need this to complete the dashboard.
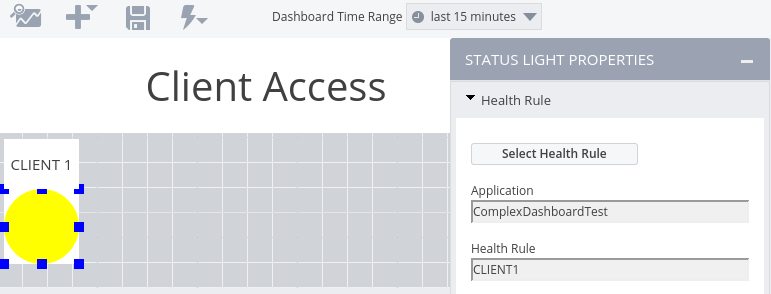
Put a label with the text Client Access and place it at the top of the dashboard, add a label for the first status light with the text CLIENT 1 and then add the status light for client 1. The status light is linked to the health rule for CLIENT1 by selecting it in the status light properties.
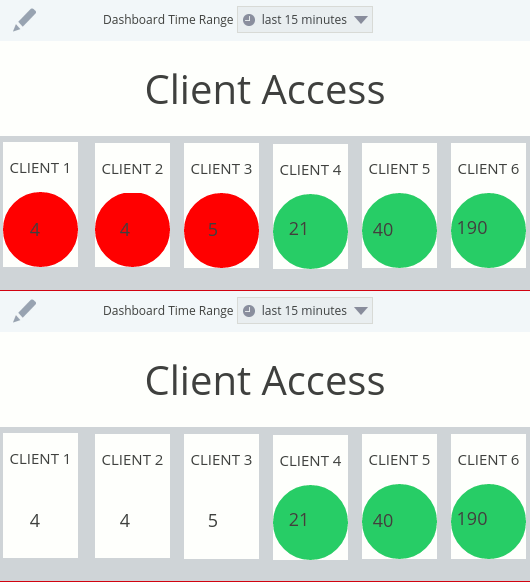
We can now repeat these steps for the remaining 5 clients, linking each to the appropriate health rule, and finally the dashboard looks like this
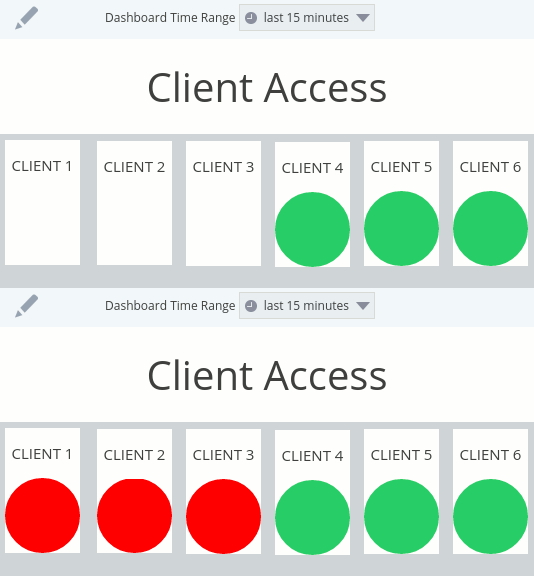
As mentioned at the start of the post, the Introscope status light can be in four states and the AppDynamics status light only three. To represent the fourth state we can put the value of the Calls per 960 Minutes metric on the status light as a dynamic label.
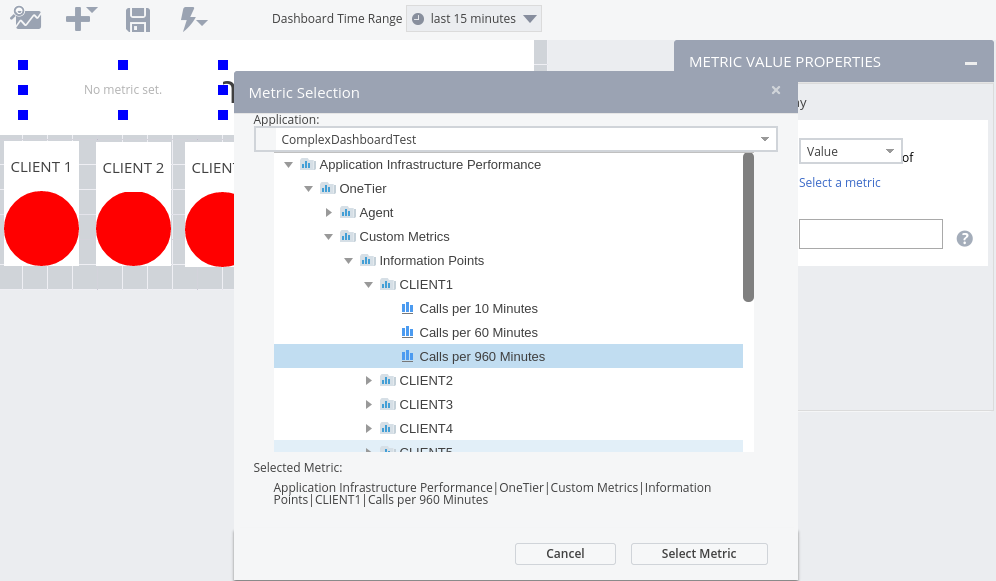
The label background is set as transparent, and sized so that it will fit on the status light for client 1. After adding a metric label for each client, the dashboard is complete. We now have a fully functional dashboard which displays the same information as the original Introscope dashboard. In fact, it shows a little more information because we added the ‘calls today’ label on the status to make up for the missing fourth state. Knowing the number of calls for the day is much better than just having a red light meaning ‘some calls today but nothing in the last hour’.
Conclusion
Using the AppDynamics REST API and Standalone Machine Agent allows you to do powerful enrichment of the metric information in AppDynamics. You could, for example, monitor an internal legacy system through a custom built API and combine that data with information already captured by AppDynamics. This can then be stored as a new metric which you can use to visualise the data.